TRAVERSE Global v11.1
Trend Analysis Report
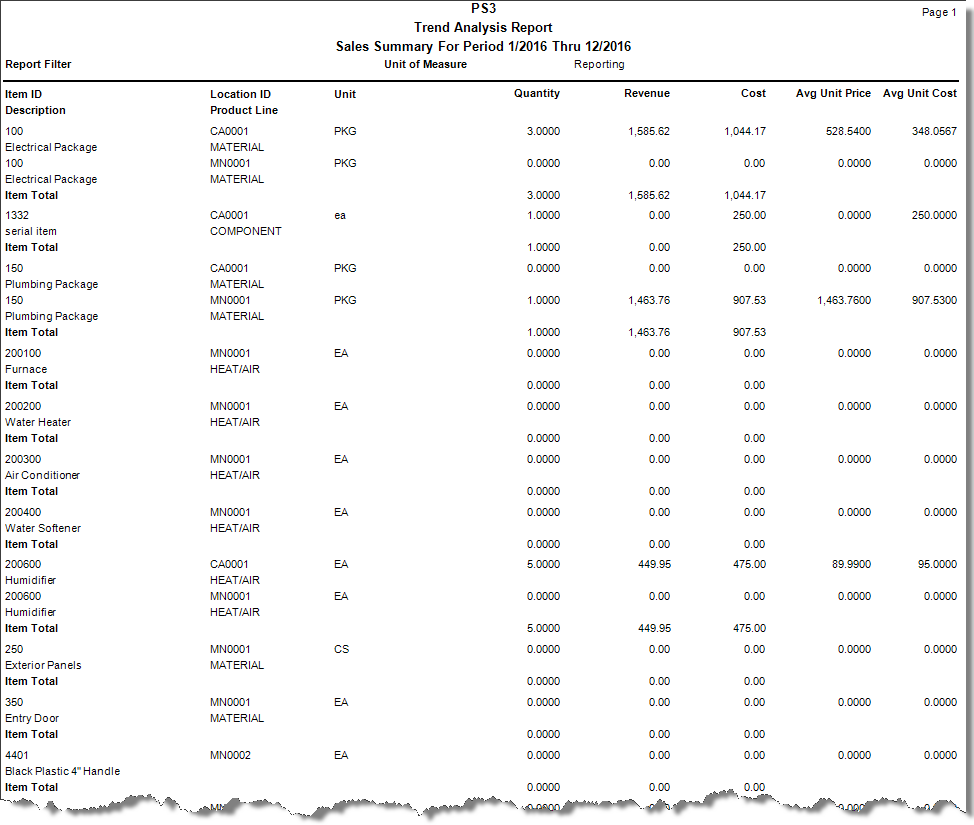
The Trend Analysis Report shows the number of items you sold during a period. You can use it to analyze trends in the sales of your inventory items.
The following calculations are used in the report:
| Field | Calculation |
| Quantity (purchases) | Quantity purchased - Quantity returned |
| Quantity (sales) | Quantity sold - Quantity returned |
| Revenue (sales) | Total sold - Total returned |
| Cost (purchases) | Cost of purchases - Cost of returned purchases |
| Cost (sales) | Cost of sales - Cost of returned sales |
| Avg Unit Price (sales) | (Total sold - Total returned) / (Quantity sold - Quantity returned) |
| Avg Unit Cost (sales) | (Cost of sales - Cost of returned sales) / (Quantity sold - Quantity returned) |
| Avg Unit Cost (purchases) | (Cost of purchases - Cost of returned purchases) / (Quantity purchased - Quantity returned) |
- Use the Data Filter to select the range of filtering options or leave the filter blank to include all available data.
- Select the date range for the report from the Fiscal Period/Fiscal Year From and Thru fields.
- Select the transaction type for the report from the View section.
- Select whether to include additional detail in the report by selecting the Print Detail check box.
- Select Reporting or Base for the unit of measure from the Unit of Measure field.
Select To Reporting Get the quantities printed on the report in the unit of measure you selected as the reporting unit of measure on the Unit Defaults tab in the Item setup. Base Get the quantities printed on the report in the base unit of measure set up for the items. - Click a command button to
| Click | To |
| Process the Trend Analysis Report. | |
| Output | Output the reports as a PDF. |
| Send | Save the report as a PDF and attach it to an email using your default mail program. |
| Preview | View a preview of the Trend Analysis Report. |
| Reset | Set all fields to their default values. |

