Traverse Standard v11.0
AR Analysis Report
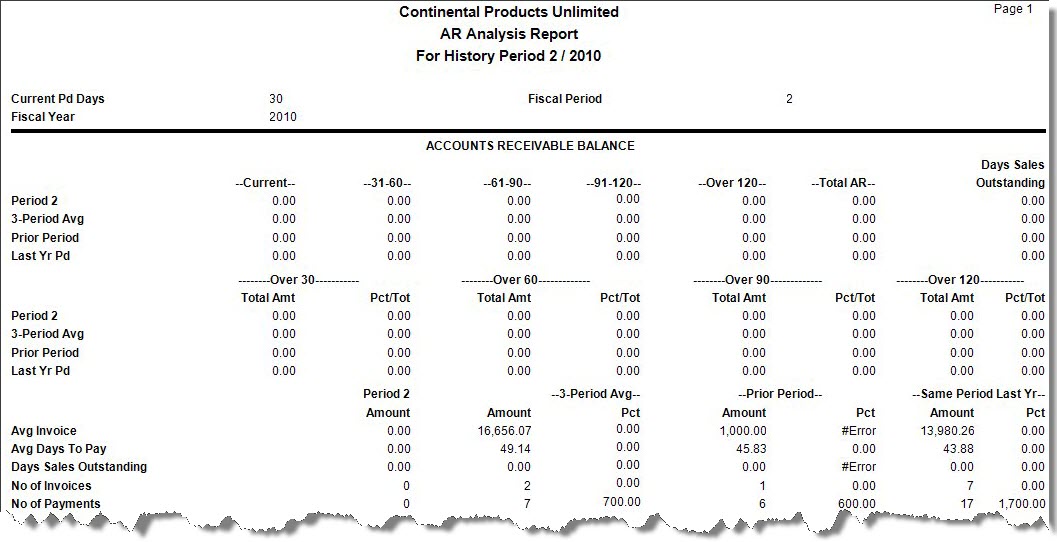
Use the AR Analysis Report to provide you with an analysis of your company's outstanding receivables. The report has three parts. Each part compares the receivables of a period you specify with those of the previous period, the previous three periods, and the same period of the previous year. This information is pulled from the Transaction and Payment history tables.
The AR Analysis Report comprises the following sections:
The first section of the report shows the total sales, a breakdown of sales into aging buckets, and the number of days sales were outstanding for more than 30, 60, 90, and 120 days.
- The Total AR column includes finance charges, which are not included in the individual aging columns.
- The three-period average is a total of the previous three periods divided by three.
- The number of days sales were outstanding is calculated with the following equation:
Total AR/(total company sales/number of days in the period)
- The Days Sales Outstanding column provides a guideline for how well receivables are keeping pace with sales. The higher the number, the further receivables are from sales.
- In the sample report, the Days Sales Outstanding for the current period is more than three times less than it is for the same period last year. It might be lower because customers are taking less time to pay on their accounts this year or because sales for the same period and the same amount of receivables are higher this year than last year.
Note: The number of days in the current period is the number you enter on the AR Analysis Report screen. The other periods use 30 days as an average.
The second section shows a composite of receivables that are outstanding for more than 30, 60, 90, and 120 days.
- The total amount over 30 includes amounts that are over 60, 90, and 120; the total amount over 60 includes amounts that are over 90 and 120 days old; and so on.
- Total AR is displayed in the first section of the report.
The Pct/Tot figure is the Total Amt/Total AR.
The third section shows the average invoice amount, number of days sales were outstanding, number of invoices sent to customers, and number of payments received from customers.
- Avg Invoice is calculated with the following equation:
Avg Invoice = Total company sales this period / (# of invoices)
- Avg Days To Pay is calculated with the following equation:
Avg Days to Pay = Total days to pay / # of payments
- Pct is the three-period average amount divided by the current period amount.
- Select the history period for the report from the Period field.
- Select the fiscal year for the report from the Year field.
- Select the number of days in the period for the report from the Days In Period field. Note: The number of days available depends on the length of the period you select when you set up the company.
- Click a command button to
| Select | To |
| Print the AR Analysis Report using the selected criteria. | |
| Output | Output the report as a PDF. |
| Send | Save the report as a PDF and attach it to an email using your default mail program. |
| Preview | Preview the AR Analysis Report using the selected criteria. |
| Reset | Reset all fields and lists to their default selections. |
