Traverse Global v11.2 - Service Repair
Production Variance Analysis
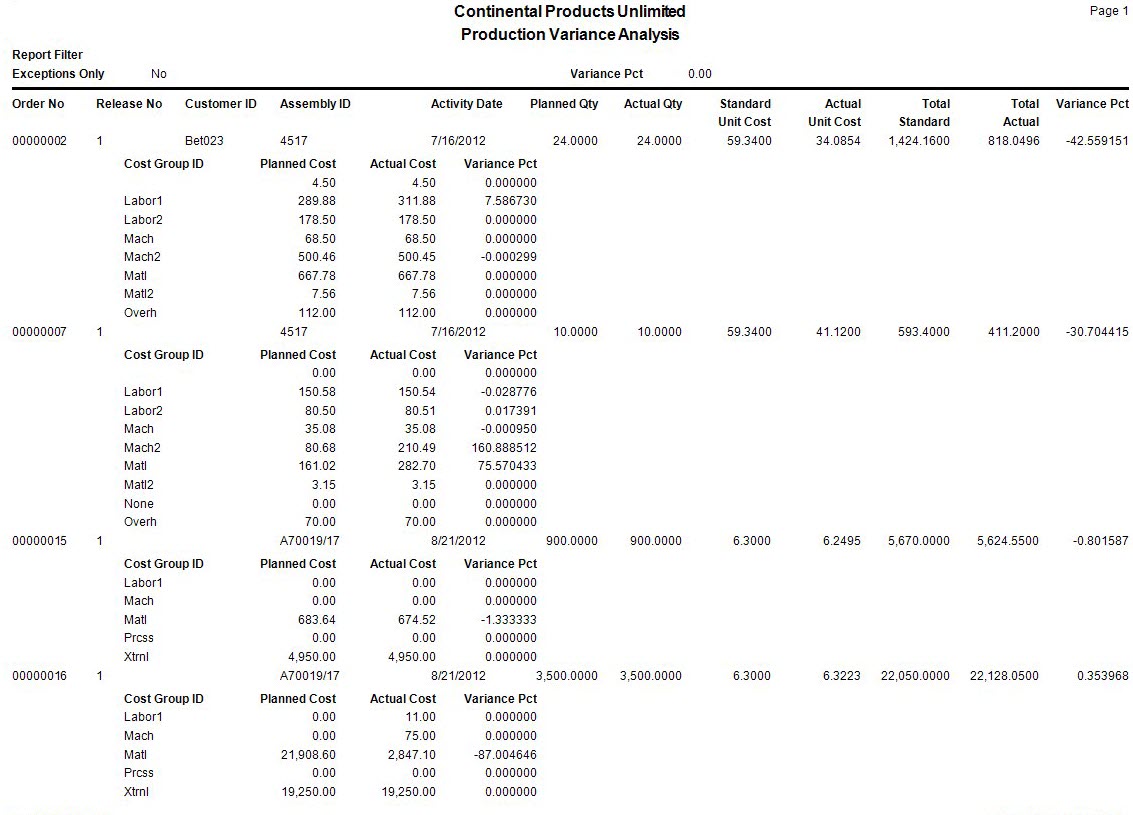
The Production Variance Analysis report examines unplanned variances in finished goods. Use this report to compare the quantity you planned to produce against the actual production quantity, and to compare the actual finished good unit cost against the standard unit cost. Component and process costs are included, broken down by cost code. The report serves as a great starting point for locating quantitative or cost-oriented output variances. To attain more cost input variance detail, use the Cost Variance Analysis and Time Variance Analysis report.
- Use the Data Filter to select the range of filtering options or leave the filter blank to include all available data.
- Select the Exceptions Only check box, if applicable, to only view exceptions in the report.
Note: If you select this check box, you must enter a variance percentage, corresponding to the exceptions, in the Variance Pct field. The value defaulted will be the value entered in the business rules. - Select, if applicable, a range of activity dates to include in the report from the Activity Date From and Thru fields.
- Click a command button to
| Select | To |
| Print the Production Variance Analysis report using the selected criteria. | |
| Output | Output the list as a PDF. |
| Send | Save the list as a PDF and attach it to an email using your default mail program. |
| Preview | Preview the Production Variance Analysis report using the selected criteria. |
| Reset | Reset all fields and lists to their default selections. |