Traverse Standard v11.0
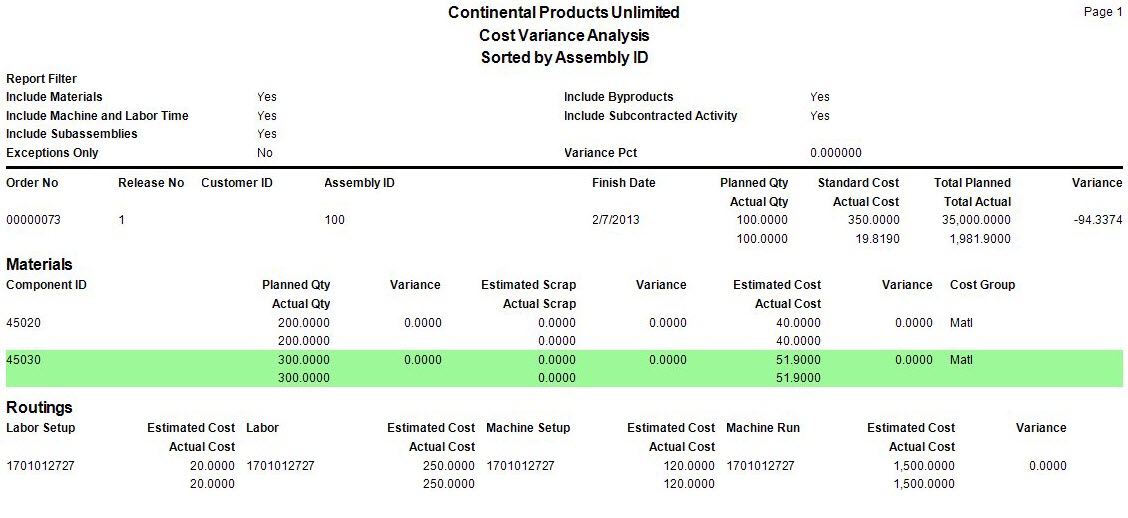
Cost Variance Analysis
Use this report to review past production and analyze situations where the actual production cost ended up notably different than the expected cost.
- Use the Data Filter to select the range of filtering options or leave the filter blank to include all available data.
- Select, if applicable, an estimate finish date range to include in the report from the estimated Finish Date From and Thru fields.
- Select, if applicable, a range of components to include in the report from the Component ID From and Thru fields.
- Select the sort criteria for the report from the Sort By section.
- Select options to include in the report from the Include section.
- Select the Exceptions Only check box, if applicable, to only view exceptions in the report.
Note: If you select this check box, you must enter a variance percentage, corresponding to the exceptions, in the Variance Percent field. The default setting for this field is set in the business rules but it may be edited it at this point. If the percentage of variance is equal to or greater than the percentage in this field, the transaction will appear on the report.For Example: Standard Cost is $5.00 and the Actual Cost is $6.00, the variance will be $1.00 or more importantly, 20%.
- Select the Banded Rows check box, if applicable, to highlight alternating lines on the report to make the report easier to read.
Note: Use the System Manager Print Preferences function to define the default setting for this check box. You can then override this default when you print the report. - Click a command button to
| Select | To |
| Print the Cost Variance Analysis report using the selected criteria. | |
| Output | Output the list as a PDF. |
| Send | Save the list as a PDF and attach it to an email using your default mail program. |
| Preview | Preview the Cost Variance Analysis report using the selected criteria. |
| Reset | Reset all fields and lists to their default selections. |