Traverse Global v11.2 - Service Repair
Interactive Views
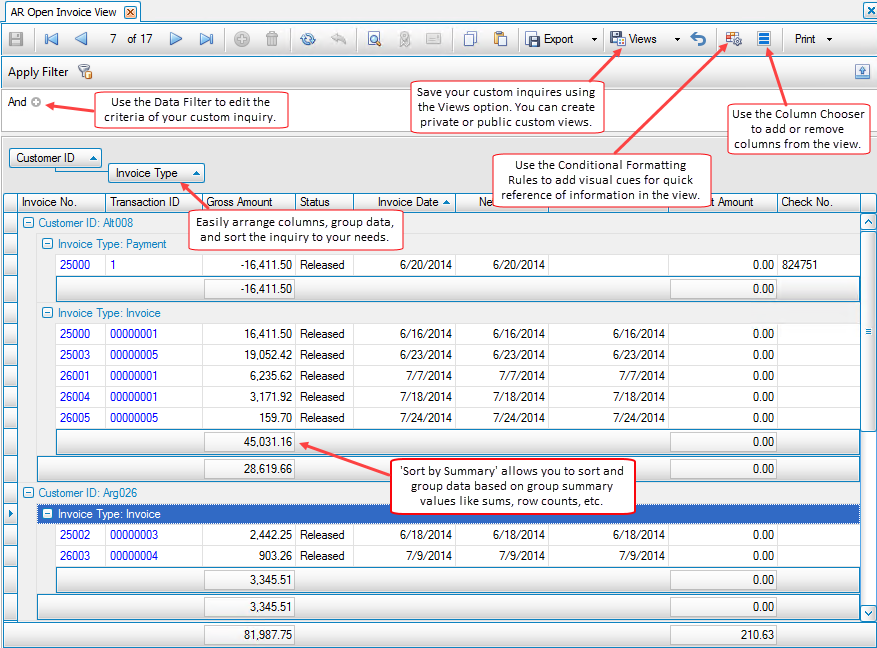
The Traverse interactive view functions display information in an interactive format; these are highly configurable data screens that allow you to sort, group, and output the view according to your unique needs. Most views also include a totals bar, making it easier to add analysis values to the data.
You can find more details about using interactive views in the Traverse Interactive View Tutorial.
The print preview window commands are on a ribbon toolbar. These commands are similar to the ones on the reporting print preview ribbon.

| Icon | Select To |
|---|---|
 Thumbnails Thumbnails |
Open a panel on the left side of the preview window that will show a scaled image of each page of the report. Use these images to navigate to that page. |
 Find Find |
Open a search bar for the report. See the Search Bar topic for more information. |
 Print Print |
Choose printing options, including printer, number of copies, range of pages, and other options before printing the report. |
 Quick Print Quick Print |
Send the report directly to the default printer. |
 Margins Margins |
Edit the margins of the report. |
 Header/Footer Header/Footer |
Edit the header and/or footer of the report. |
 Scale Scale |
Adjust the zoom factor/scale the report to a percentage of the original size, or fit the report to a specified number of pages. |

|
Manually scroll through the document. You can do this by clicking and dragging the document with the mouse. |

|
Zoom in or zoom out of the page with a click of the mouse. The magnifier is a 'quick zoom' tool. |
 Zoom Out Zoom Out |
Zoom out from the document in 5% increments with each mouse click. |
 Zoom Zoom |
Choose a zoom option from the drop-down list, which includes zooming to the page width, text width, whole page, two pages, or various percentages, including a custom percentage you can enter. |
 Zoom In Zoom In |
Zoom in to the document in 5% increments with each mouse click. |
| Navigation Arrows | Navigate through the report. |
 Many Pages Many Pages |
Allow you to view one or more pages of the report or document at one time on the screen. Select the number of pages to view by dragging over the pages selector that opens when you select this option. |
 Color Color |
Select to change the background color of the preview. |
 Watermark Watermark |
Create and apply a watermark to the document. See the Watermark topic for more information. |
| Export To | Save the report as a file in one of a number of formats: PDF, HTML, MHT, RTF, DOCX, XLS, XLSX, or Image. |
| E-Mail As | Email the report as a file attachment in one of these formats: PDF or Image. The system will use the default email application. |
Group records by dragging and dropping a column header into the grouping bar.
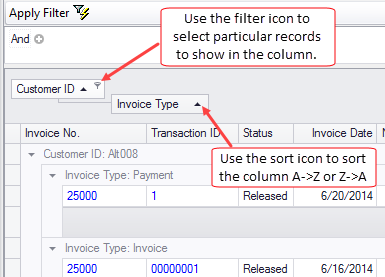
You can easily filter and/or sort each column by clicking on the column header.
Custom Views
Using interactive views, you can easily and quickly build and manipulate the view to display information in exactly the way you need it.
You can also create custom views by setting up the view the way you want, then saving it as a Named View using the Views button.
The view is private, that is, available only to you, unless you designate it as a Public view by editing the view. To edit your view, select Edit Views... in the Views menu. The Views Editor will display.
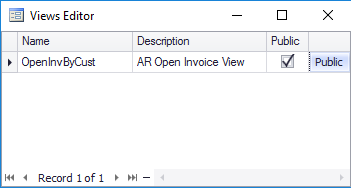
Click the Public button for the view you want to make public, then close the editor. Public views are indicated with an asterisk beside the view name.
The data filter is also used when creating reports. See Using Reports for more information about data filter options. For more information on using conditional statements, see Conditional Basics on the Using Reports page.
Each column of an interactive view has a little filter (funnel) icon you can use to filter the column by selected column criteria. You also have an option to Show Auto Filter Row if you right-click on a column header. This adds a row at the top of the data where the filter criteria can be entered. This can be easier to enter filter criteria.
In the example below, we used the Name field to find any company names that contain “inc” and entered mn in the Region column to limit the list to Minnesota companies.
Other filtering options include the standard filter criteria:
Another filter option on the right-click menu is the Show Find Panel, which opens a panel that allows you to search the entire view. Enter a search string and click the Find button. The view will display all rows containing the search term, as well as highlight that search string in the cells.
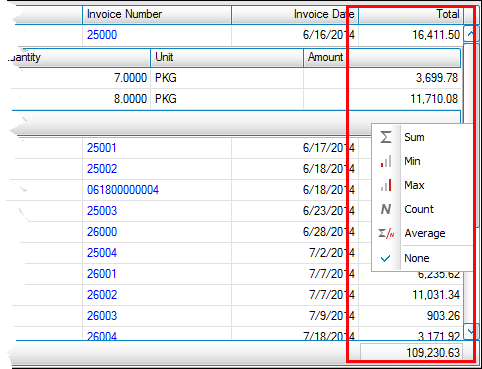
You can add summaries by group and sort by those summaries. Right-click on a group footer to select a type of group summary, including row counts and group average.
Conditional Formatting Rules
Conditional Formatting Rules are very similar to the conditional formatting used in Excel. If you are familiar with the Excel conditional formatting functionality, you will understand the conditional formatting used in the Traverse Global Interactive Views.
Conditional formatting will allow you to format records when they meet certain criteria. This criterion can be determined by:
- All cells based on their values
- Only cells that contain
- Only top or bottom ranked values
- Only values that are above or below average
- Only unique or duplicate values
- Use a formula to determine which cells to format
To set up conditional formatting, click the Conditional Formatting Rules ( ) button on the toolbar to open the conditional Formatting Rules Manager screen.
Click the New Rule... button to open the create a new formatting rule screen.
The New Formatting Rule screen is divided into two sections, a Rule Type section where you can select the type of rule to create, and the Rule Description section where you can determine how the view is formatted. The options available in the Rule Description section of the screen will depend on the rule type you choose.
Choose a rule type that will indicate the values you are interested in. For example, if you want to see all invoices greater than $5,000, you might select to use a formula to determine what cells to format: If x is greater than $5,000, then format the cell.
- All cells based on their values: All cells will be formatted depending on their value.
- Only cells that contain: Cells that contain a predetermined value will be formatted.
- Only top or bottom ranked values: Cells with values that are at the upper or lower limits of the range of cell values will be formatted.
- Only values that are above or below average: With an average value calculated from all the values in the appropriate cells, cells with values above or below that average will be formatted.
- Only unique or duplicate values: If a cell is the only cell that contains a particular value OR if multiple cells contain the same value, it/they will be formatted.
- Use a formula to determine which cells to format: You will create a formula, such as "If x is greater than or equal to y" or "If x is not equal to y", and any cells holding values that make the formula true will be formatted.
The rule descriptions allow you to determine the actual formatting of the cells that meet the rule you create. Depending on the type of rule you select, you will have different options:
| Rule Type | Rule Description |
|---|---|
| All cells based on their values | Format the cells with 2 colors on a 'sliding scale' (low to high), 3 colors on a 'sliding scale' (low, middle, high), data bars (like a bar chart), or icon sets (scale indicated with colored or filled icons such as stars) |
| Only cells that contain | Format the cell depending on the cell value or the date occurrence you select. Formatting options include cell fill and font color. |
| Format only top or bottom ranked values | Select whether to format cells with value at the top end or bottom end of the value range, within a percentage of the upper or lower limit. Formatting options include cell fill and font color. |
| Format values above or below average | Once the average of all cells in the selected range is calculated, select to format cells that have values above or below that average. Formatting options include cell fill and font color. |
| Cells with duplicate values OR the only cell with a particular (unique) value | Select whether to format duplicate or unique cells. Formatting options include cell fill and font color. |
| Use a formula to determine which cells to format |
|
Example:
Using the AR Open Invoice View, we want to have a visual reference for the invoice amounts. We will do this using conditional formatting.
- Open the Conditional Formatting Rules screen and click the New Rule... button.
- Select the rule type to format all cells based on their values.
- Establish the format style and range for the cell values to format. In our example, we are choosing a 2-color scale. The range, by number, is from 0 to 20,000 ($0 to $20,000). We will keep the default green (low) to red (high) color scale.
- Click OK. The Conditional Formatting Manager screen appears. On this screen, you can select the column used to determine if the record meets the rule, and the column to receive the formatting.
- In our example, we want to apply the criteria to the Gross Amount column of the AR Open Invoice View, and we want to apply the formatting to the Gross Amount column. Mark the Stop if True check box if you want the system to stop checking values as soon as it hits a cell that meets the rule criteria; otherwise, leave the check box blank.
- Click the Apply button to apply the formatting rule to the view. Use the Edit Rule... button to make changes to the rule or formatting.
Notice as the values in the cells get closer to either the max value or the min value, the color gets more green or more red depending on how close they are to the min/max.
To make changes to the rule, use the Conditional Formatting Rules button on the toolbar to reopen the Conditional Formatting Rules Manager screen.
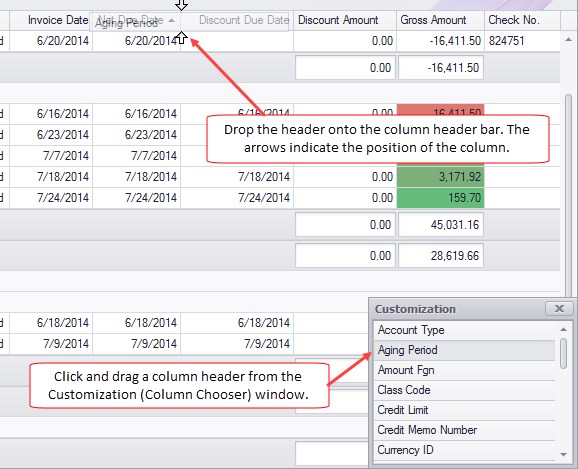
Column Chooser
Use the Column Chooser to add or remove columns from the view. When you click the Column Chooser button on the toolbar, the Customization (Column Chooser) window appears.
To add columns to the view, drag a column name from the Column Chooser window and drop it onto the column header bar. The column will appear in that position.
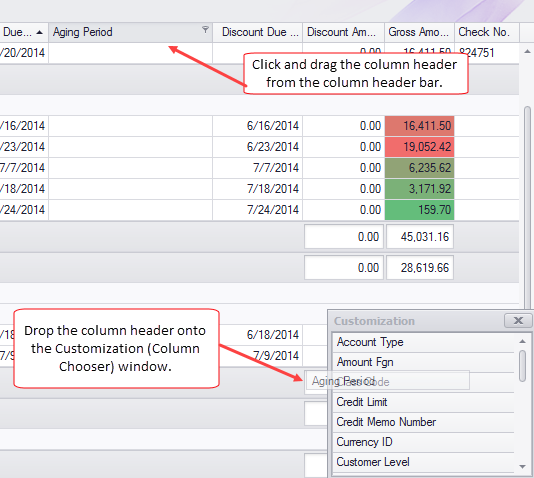
To remove columns from the view, drag a column header from the column header bar and drop it onto the grid, or the Column Chooser window.
You can find more details about using interactive views in the Traverse Interactive View Tutorial.
The following are links to movies describing the different types of interactive views: