Traverse Global v11.2
Using Reports
You can personalize the way you view reports in Traverse. Reports now allow you to select criteria to display in the report before printing as well as show the username of the person who generated the report. Depending on the report, you can select to include a range of data or select whether to display certain criteria within the report.
You can set your user Preferences to enable lookup controls for key fields in the report and view filters by selecting Preferences... from the View menu, and setting Display Lookups in Filters to True. This allows you to use all filtering options in those controls. Save your preferences.
The Print, Preview, and Reset buttons appear on the top toolbar of the reporting functions.
| Button | Select To |
|---|---|

|
Print the report. Cloud Print window only appears if you elect to use Enable Cloud Print in the Business Rules. |

|
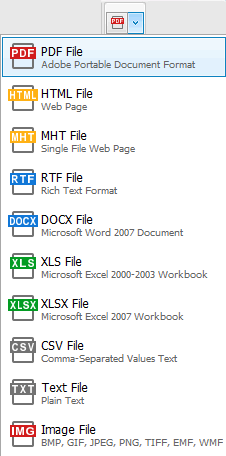
Output the report in PDF format. A Save File window will appear, allowing you to browse to the location to save the report in PDF format. |

|
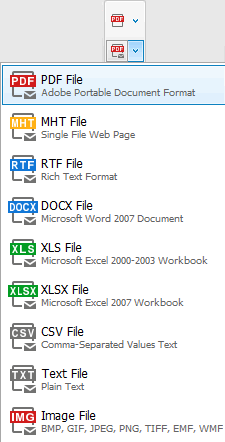
Save the report as a PDF file, If the "Use MAPI" business rule is set to Yes, It will open the default email program to send an email with the report as an attachment. If the "Use MAPI" business rule is set to No, you can send an email through cloud environement. |

|
Preview the generated report. Note: See the Preview Toolbar section to view the available functions on the preview screen. |

|
Set all fields to their default values. |
The generated report preview includes a ribbon bar that is divided into multiple sections. Use the following buttons to perform the described functions.

Document section

| Icon | Select To |
|---|---|
| Open | Open a file. |
| Save | Save the file. |
Print section

| Icon | Select To |
|---|---|
| Choose printing options, including printer, number of copies, range of pages, and other options before printing the report. Cloud Print window only appears if you elect to use Enable Cloud Print in the Business Rules. | |
| Quick Print | Send the report directly to the default printer. |
| Options | Opens the Print Settings window, in which you have additional options regarding print formatting. See the Print Settings topic for more information. |
| Parameters | Set up additional printing options. |
Page Setup section

Note: Use the small arrow in the lower right corner of the section to open a page setup window, which allows you to adjust orientation, margins, and paper size in one place.
| Icon | Select To |
|---|---|
| Header/Footer | Edit the header and/or footer of the report. |
| Scale | Adjust the zoom factor/scale of the report to a percentage of the original size, or fit the report to a specified number of pages. |
| Margins | Edit the margins of the report. |
| Orientation | Select to print the report in portrait or landscape orientation. |
| Size | Choose the paper size for the report. |
Navigation section

| Icon | Select To |
|---|---|
| Find | Open a search bar for the report. See the Search Bar topic for more information. |
| Thumbnails | Open a panel on the left side of the preview window that will show a scaled image of each page of the report. Use these images to navigate to that page. |
| Bookmarks | Open a panel on the left side of the preview window that will show a list of bookmarks available in the report. This option is only available if there are bookmarks in the report. |
| Editing Fields | Edit document content if there are editing fields in the report. The editing fields are added to reports when they are designed. |
| Navigation Arrows | Navigate through the report. |
Zoom section

| Icon | Select To |
|---|---|

|
Show the mouse pointer. |

|
Manually scroll through the document. You can do this by clicking and dragging the document with the mouse. |

|
Zoom in or zoom out of the page with a click of the mouse. The magnifier is a 'quick zoom' tool. |
| Many Pages | Allow you to view one or more pages of the report or document at one time on the screen. Select the number of pages to view by dragging over the pages selector that opens when you select this option. |
| Zoom Out | Zoom out from the document in 5% increments with each mouse click. |
| Zoom | Choose a zoom option from the drop-down list, which includes zooming to the page width, text width, whole page, two pages, or various percentages, including a custom percentage you can enter. |
| Zoom In | Zoom in to the document in 5% increments with each mouse click. |
Page Background section

| Icon | Select To |
|---|---|
| Page Color | Open the standard system color palette. The page color you choose will change the color of the page area surrounding the report itself. |
| Watermark | Create and apply a watermark to the document. See the Watermark topic for more information. |
Export section
 MMMMMMM

| Icon | Select To |
|---|---|
| Export To ... | Save the report as a file in one of a number of formats: PDF, HTML, MHT, RTF, DOCX, XLS, XLSX, CSV, TXT, or Image. |
| E-Mail As ... | Email the report as a file attachment in one of a number of formats: PDF, MHT, RTF, DOCX, XLS, XLSX, CSV, TXT, or Image. The system will use the default email application. |
Close section

Use the Close button to close the report preview.
The OK, Print Log, Activity, and Reset buttons now appear on the top toolbar of the batch processes, posting, etc.
| Button | Select To |
|---|---|

|
Begin processing the batch, posting, etc. |

|
Print the log from the last time you posted. |

|
Open the Activity dialog box where you can view information about previous post actions, including run time, user ID, and comments, as well as internal sequence numbers and run IDs. |

|
Set all fields to their default values. |
Use the Data Filter from report pick screens to build a condition to filter the generated report. A filter condition can consist of up to four options. Each option within the condition appears as a different color help distinguish it from the other options, Black Text [Blue Text] Green Text <gray text>. The instructions below illustrate how to build a condition.
- Select how to group values by clicking the black text component (See Table 1).
- Select a column heading to filter by clicking the blue text component .
- Select the filtering criterion by clicking the green text component (See Table 2).
- Enter, if applicable, a string of text or numbers to complete the condition by clicking the gray text component.
- Click the
 icon to add additional conditions if applicable.
 - Use the Print, Preview, or Reset buttons to generate the report or set all fields to their default values.
| Button | Name |

|
And |

|
Or |

|
Not And |

|
Not Or |

|
Add Condition |

|
Add Group |

|
Clear All |
| Table 1 - Black Component | |
| Button | Name |

|
Equals |

|
Does not equal |

|
Is greater than |

|
Is greater than or equal to |

|
Is less than |

|
Is less than or equal to |

|
Is between |

|
Is not between |

|
Contains (text only) |

|
Does not contain (text only) |

|
Begins with |

|
Ends with |

|
Is like |

|
Is not like |

|
Is blank |

|
Is not blank |

|
Is any of |

|
Is none of |
| Table 2 - Green Component | |
When you define IDs and codes, it is important for you to know how they appear in a field list after they are sorted. Traverse sorts alphanumeric data alphabetically by comparing first characters, then second characters, and so forth. When two alphanumeric characters are compared, the character with the smaller ASCII value comes first in the alphabetic sort.
The list of alphanumeric characters is in ascending alphabetic order:
- Special characters (-, *, /, and so forth)
- Numbers (0-9)
- Uppercase letters (A-Z)
- Lowercase letters (a-z)
Alphabetical rules are not intuitive when numbers are involved. For example, in numerical sorting 60 comes before 112; however, in alphabetical sorting 112 comes before 60. To ensure that numbers appear in the same order in both an alphabetic and numeric sort, pad numbers to the left with zeros until they are the same length. For example, if 60 is defined as 060, 060 comes before 112 in both an alphabetic and a numeric sort.
| Sort | By |
| Ascending | Clicking the column heading until the  appears appears |
| Descending | Clicking the column heading until the  appears appears |
Use conditional statements to determine the data you can see in the view. There are four conditionals available to you for your interactive view or report:
AND
The AND conditional requires all records to match all conditions you set. If you set conditions that contradict each other, such as “City begins with P AND City begins with R”, your view will have no results, because a city cannot begin with both P and R at the same time.
If you set conditions that can exist at the same time, you will get results from your filter. For example, this filter: “City begins with P AND City ends with E”, will include records for Phoenixville, Pine Grove, and Pipersville, but not Philadelphia, Paoli, or Adamsville.
OR
The OR conditional requires all records to match only one of the conditions you set. If you set conditions that contradict each other, such as “City begins with P OR City begins with R”, your view will have results that include only cities that begin with either P or R.
For example, this filter: “City begins with P OR City ends with E”, will include records for Phoenixville, Bernville, Crum Lynne, Philadelphia, Paoli, and Adamsville, but not Bryn Mawr or Appleton.
NOT AND
The NOT AND conditional requires all records to not match all conditions you set. If you set conditions that contradict each other, such as “City begins with P NOT AND City begins with R”, your view will have the same results as only setting the condition of “City begins with P”, because a city cannot begin with both P and R at the same time anyway.
The conditions you set will eliminate all records that meet both conditions. For example, this filter: “City begins with P NOT AND City ends with E”, will include records for Philadelphia, Appleton, Osceola, and New Prague, but not Phoenixville, Pine Grove, or Pipersville.
NOT OR
The NOT OR conditional requires all records to not match any conditions you set. This is an elimination conditional that will exclude any records that match any of the conditions you set.
For example, this filter: “City begins with P NOT OR City ends with E”, will include records for Appleton, Osceola, and Bryn Mawr, but not Phoenixville, New Prague, Philadelphia, or Bernville.
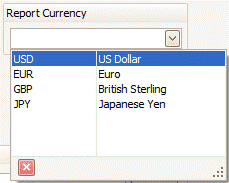
A simplified "Report Currency" selection mechanism is available for reports containing costing or other financial data.

By default, no currency is selected in the drop-down. Reports with no currency selected will show data grouped and subtotaled based on currency. Selection of a currency in the drop-down will result in a report based on the selected currency.
If a report contains costing or other financial data, and no "Report Currency" selection is available, the report will show data in the functional currency of the transactions, customer, vendor, bank, etc. reflected in the report.