Traverse Global v11.2 - Service Repair
Service Repair Dashboards
Use Dashboards to get a quick overview of particular metrics. Dashboards can be configured as graphs or tables, giving you flexibility in how you want to see the data.
You can find more information about how to work with dashboards in the Dashboard Tutorial in the Traverse Knowledge Base.
Dashboard - Setup
Before you can use the Dashboard application, you must enable the applicable using the procedures outlined below. Follow the process carefully, because the choices you make determine how the system operates.
To enable the Dashboard application, follow these steps:
- Click View on the menu bar.
- Select Preferences.
- Select True from the Show Dashboard field.
- Click Save.
- Close the Preferences window.
- Click View on the menu bar.
- Select Dashboard to enable the Dashboard function.
For any of the dashboards, you can expand the object parameters using the toggle button ( ), which allows you to adjust the Workstation Date field parameter. Refresh the dashboard to display the analysis using a different starting date. Some dashboards also allow you to filter by different field criteria, such as Location ID or Percentage Variance, or sort by such options as 'Work Type', 'Job Type', or 'Department'.
Available SR Dashboards
This dashboard displays the variance between each job's estimated cost and actual cost.

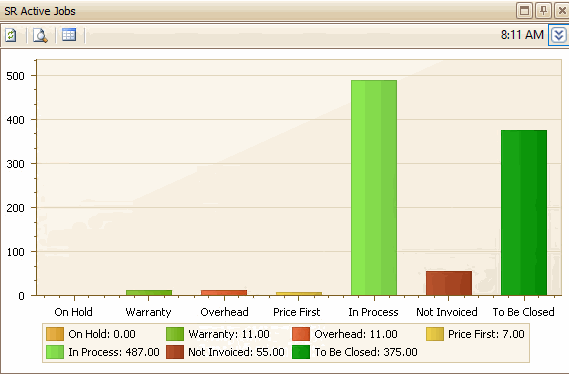
This dashboard displays the number of active jobs and the job's status. Click on the job status category in the chart view to see details of the jobs that make up that category.

This dashboard shows a count of jobs by current work type. Click on the work type in the chart view to see job tracking details.
![]()
The following dashboards give you access to planning boards, which allow you to update various data from the dashboards. See the Planning Boards Overview topic for more information.
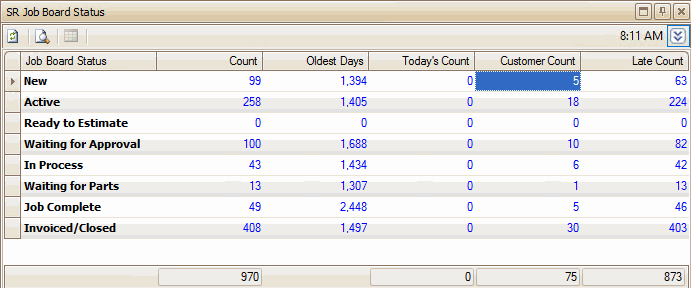
This dashboard shows information about the status of job transactions. Click on the transaction in the chart view to open the Job Board Status Updates screen, which allows you to update certain values from the Job Board Status dashboard. See the Job Board Status Planning Board topic for more information.

| Job Board Status | Criteria |
|---|---|
| New | The job has been received (it exists). No time or material has been consumed on the job. The job is in an 'Estimate' or 'Approval' status. |
| Active | Time and/or materials have been consumed on the job. The job is in an 'Estimate' status. The estimate is not complete. The job is not approved. |
| Ready to Estimate | Job work types are flagged as 'Scheduled' (not all work types are required to be flagged). All work types that have the 'Schedule During Estimate' box marked have a completed date. Labor and material do not need to be consumed. |
| Waiting for Approval | The Estimate Complete date is populated. The job is in the 'Estimate' status. |
| In Process | Status is 'Approved'. Labor or material do not need to be consumed to the job. There are no incomplete POs; i.e. all quantities have been received. Any work type that is not assigned does not affect this job board status. If a work type does not have a complete date, and someone selects to approve the job, the status will change to 'In Process'. Note: Jobs can go into the 'In Process' bucket several times. |
| Waiting for Parts | Status is 'Approved'. Incomplete PO(s) are attached to the job; i.e. some quantities are not yet received. Once all the parts are received, the job will be 'In Process'. |
| Job Complete | All scheduled work types ('Schedule' check box is marked in Job Transactions function) have been completed. If work types are not used, the ship date is used instead. Job Status must be open. The job does not need to have consumed materials or labor. It does not matter if the job is approved or not approved. |
| Invoiced/Closed | Job is still open (not in history). The job has been either invoiced or closed; i.e. the Final Billing Complete flag is marked. Note: An approved job that has invoices from estimate lines, has no consumed material or labor, and has not completed any schedule is also considered 'Invoiced/Closed'. |
The Job View dashboard shows information about jobs. Click on the job transaction number, job status, or promise date to see details. Use the Job Status or Promise Date links to open the Job View Updates screen, which allows you to update certain information.

The Job Purchases dashboard shows information about purchases that are linked to jobs. Click on the Linked Purchase Orders field to open the Job Purchase Order View for the transaction. Use the Part Constraints field to open the Part Constraints Update screen, or the PO Constraints field to open the PO Constraints Update screen.
